IDL plot object quirks
This page contains a list of
quirks related to using IDL plot objects. For example, unexpected
behavior or tricks that aren't obvious.
Size of saved images
When you to save a plot to a png or jpeg and you want the
resolution (in pixel size) to exactly match the IDL plot window, use
resolution=97:
IDL> p.save,'image.png',resolution=97
Why is my image so small?
If you have a fairly small image (say 100x100) and you use the
image function to plot it, you'll notice that it's very small on the
screen. This is because IDL plots it at the image resolution by default. To
make it fill the display better, use the margin keyword:
IDL> p=image(img, margin=0.10)
Alternatively use the position keyword to place the image more
precisely.
Histograms
With direct graphics, histograms were plotted with psym=10.
For object graphics, there is a /histogram keyword but this doesn't
actually reproduce the psym=10 behavior. Instead you should use
/stairstep. (For me this is important when plotting spectra.)
Why do Xrange and Yrange change when over-plotting?
If you do the following:
IDL> p=plot(findgen(5))
IDL> q=plot(-findgen(10),/overplot)
You'll notice that the Xrange and Yrange will change when you
overplot q, which is of course different to how direct graphics work.
If you don't want them to change, then you can pass the Xrange and
Yrange of p to q:
IDL>
q=plot(-findgen(10),/overplot,xrange=p.xrange,yrange=q.yrange)
Be careful with irregular data axes for image plots
When plotting images with the IMAGE function, you can add axes
and specify the values of these axes with X and Y:
IDL> p=image(img,x,y,axis_style=2)
However, you may find strange effects in the image if X or Y
are not strictly evenly-spaced vectors. Compare the images on the left-hand sides of the two plots below:

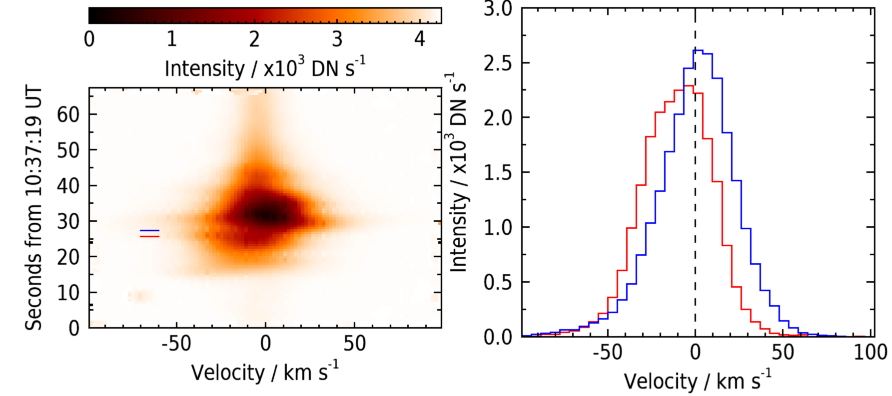
The upper one is correctly showing the image, but the lower one is
blurred and has some artifacts. The reason is that the time vector for
the data-set is not exactly evenly-spaced, so it seems IMAGE is trying
to do some sort of interpolation to correct for it. I had to create a
new time vector that was evenly-spaced. I even wrote an IDL routine
called image_fix_axis.pro to convert an axis to be evenly-spaced.
Over-plotting single points
If you only want to plot a single point, then with direct graphics you would do:
IDL> plot,findgen(5)
IDL> plots,2,3,psym=1,symsize=3
There's no equivalent of plots with object graphics, and the following command fails:
IDL> p=plot(findgen(5))
IDL> q=plot(2,3,symbol='+',sym_size=3,/overplot)
The trick is that the X and Y positions need to be specifed as
arrays, even if they're single element arrays. Thus the following does
work:
IDL> q=plot([2],[3],symbol='+',sym_size=3,/overplot)
Page maintained by Dr Peter R Young.
|