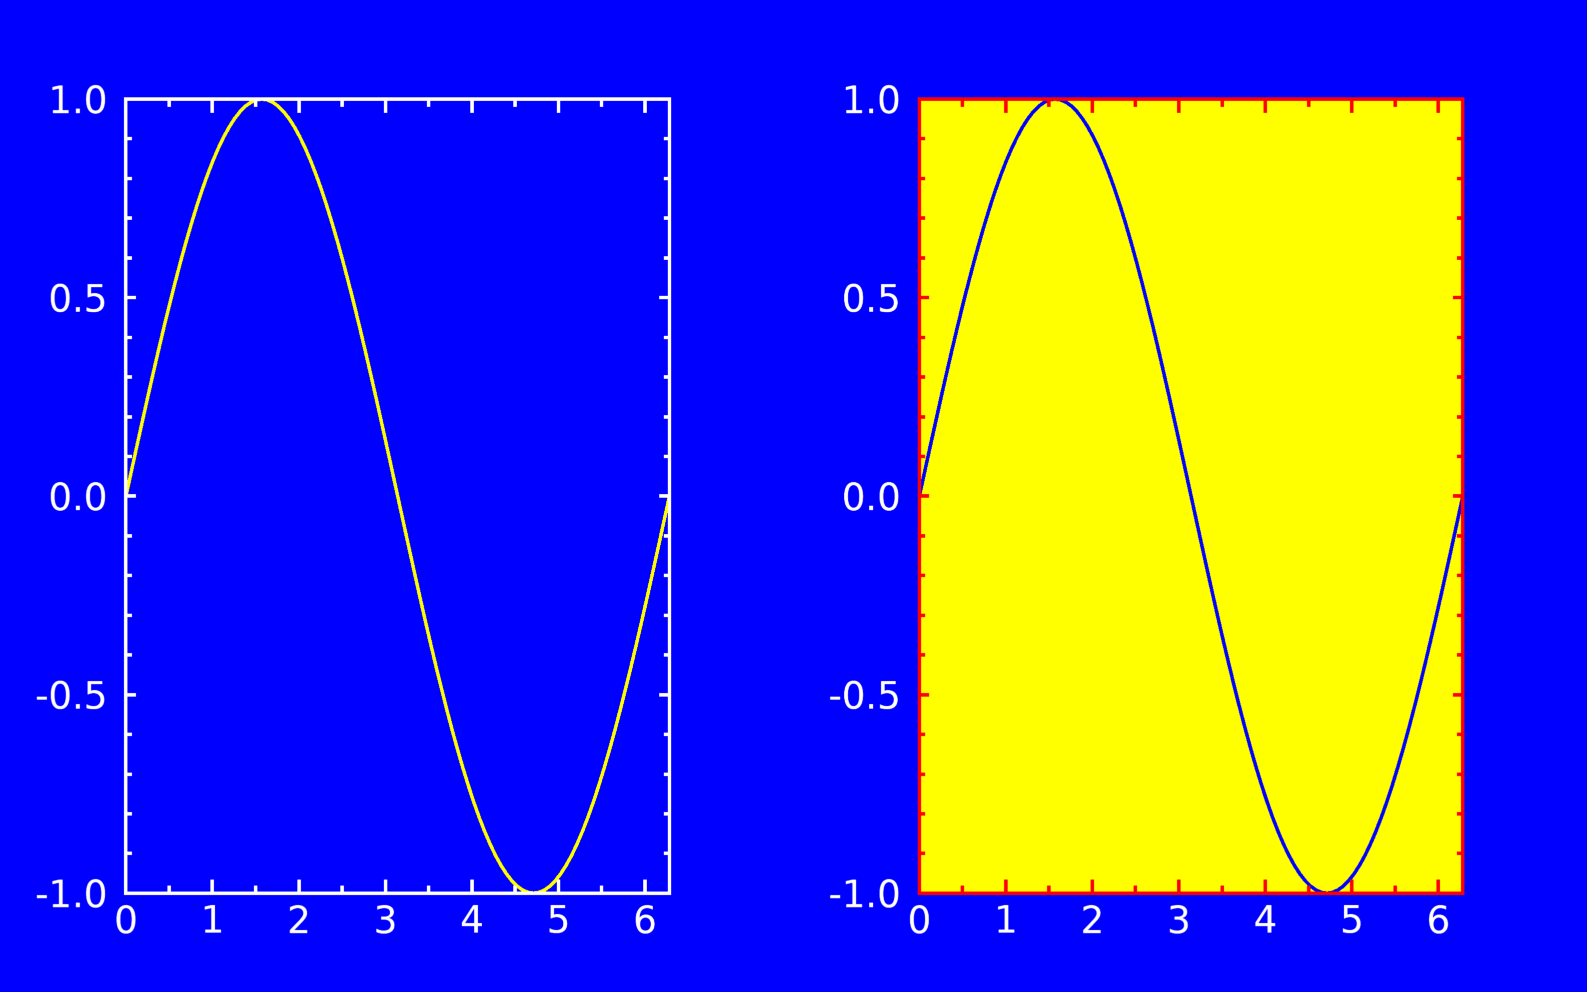
IDL plot object exercise No. 1Try to reproduce the figure below. It's a test for setting different colors for plots in the same window. The colors used are 'blue', 'yellow', 'white' and 'red'. The curve is just a sine wave.
Page maintained by Dr Peter R Young. |